> ## Documentation Index
> Fetch the complete documentation index at: https://ngquct-worktree-statusbar-redesign.mintlify.site/llms.txt
> Use this file to discover all available pages before exploring further.
# EXPLAIN Visualization
> View query execution plans as diagrams, trees, or raw output
# EXPLAIN Visualization
Click **Explain** in the query editor toolbar to get the execution plan.
PostgreSQL shows a dropdown with **EXPLAIN** (estimated plan) and **EXPLAIN ANALYZE** (runs the query and shows actual timing). MySQL, MariaDB, SQLite, and other databases show a single Explain button.
Typing an `EXPLAIN`, `EXPLAIN ANALYZE`, `EXPLAIN FORMAT=JSON`, or MariaDB's `ANALYZE FORMAT=JSON` statement in the editor and running it opens the same plan viewer, as long as the plan comes back in a single column. Multi-column plans like MySQL's plain `EXPLAIN` table stay in the results grid.
 ## View Modes
Toggle between three views using the segmented control above the results:
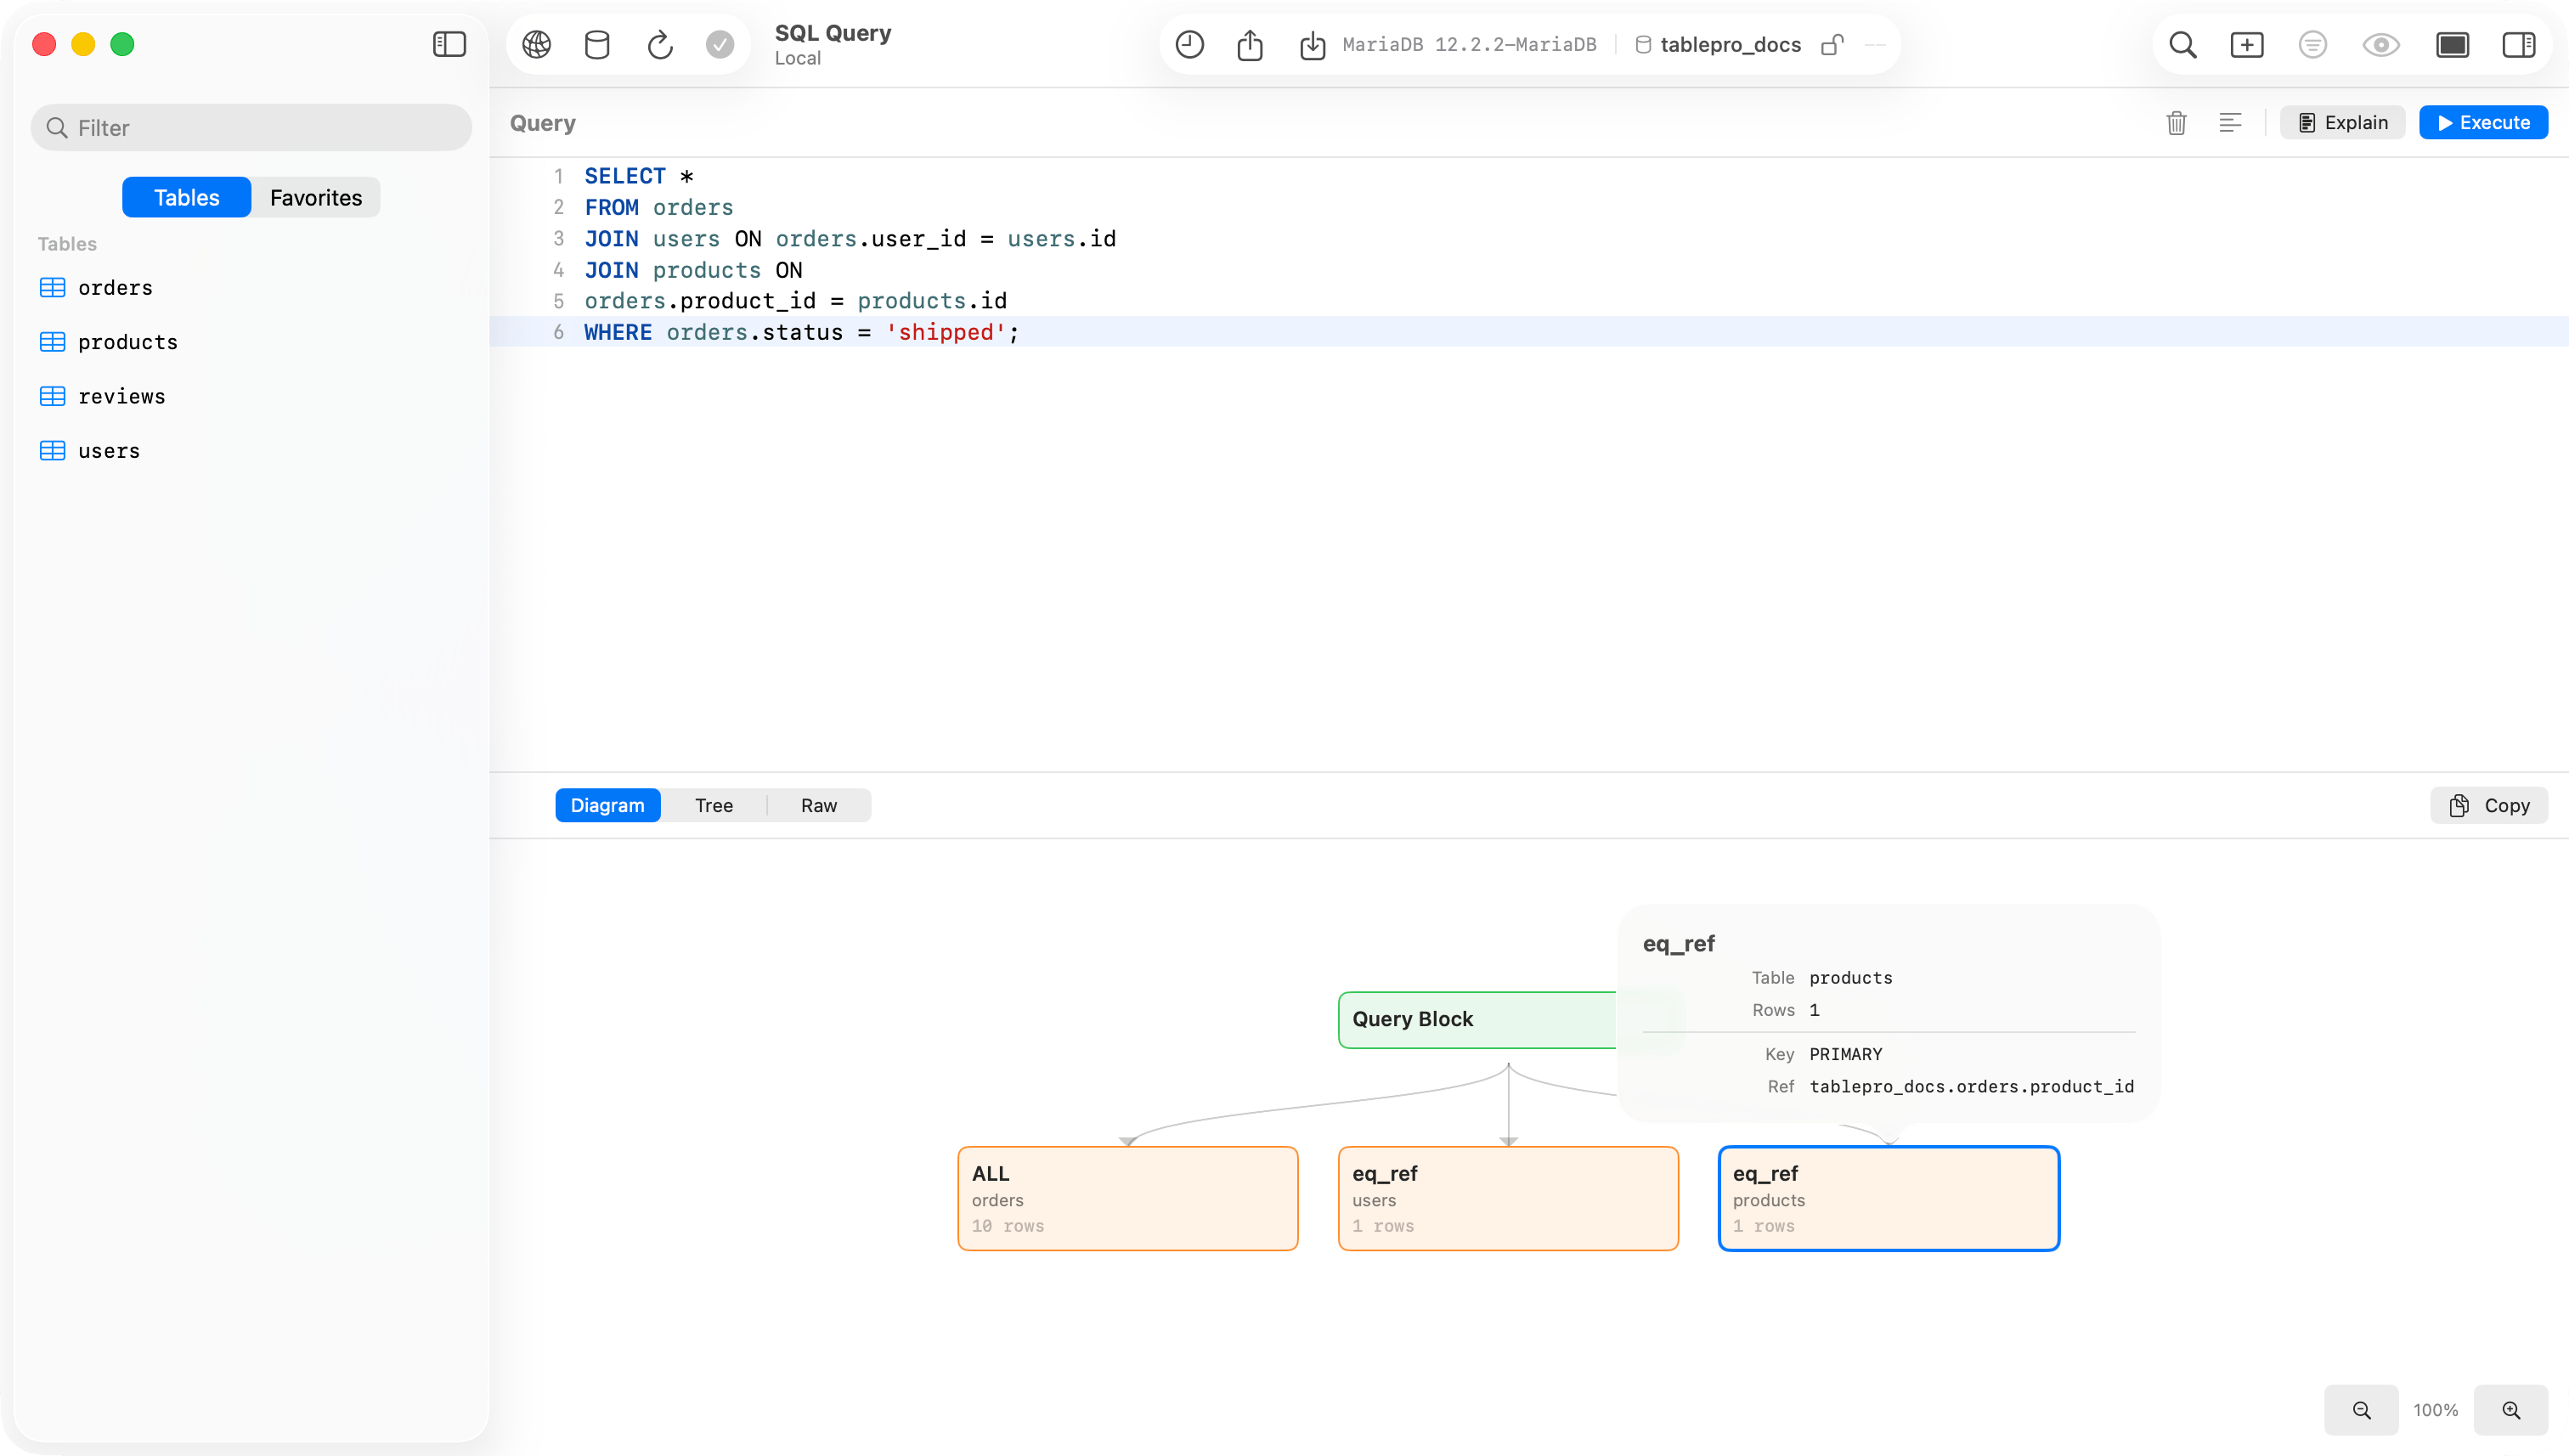
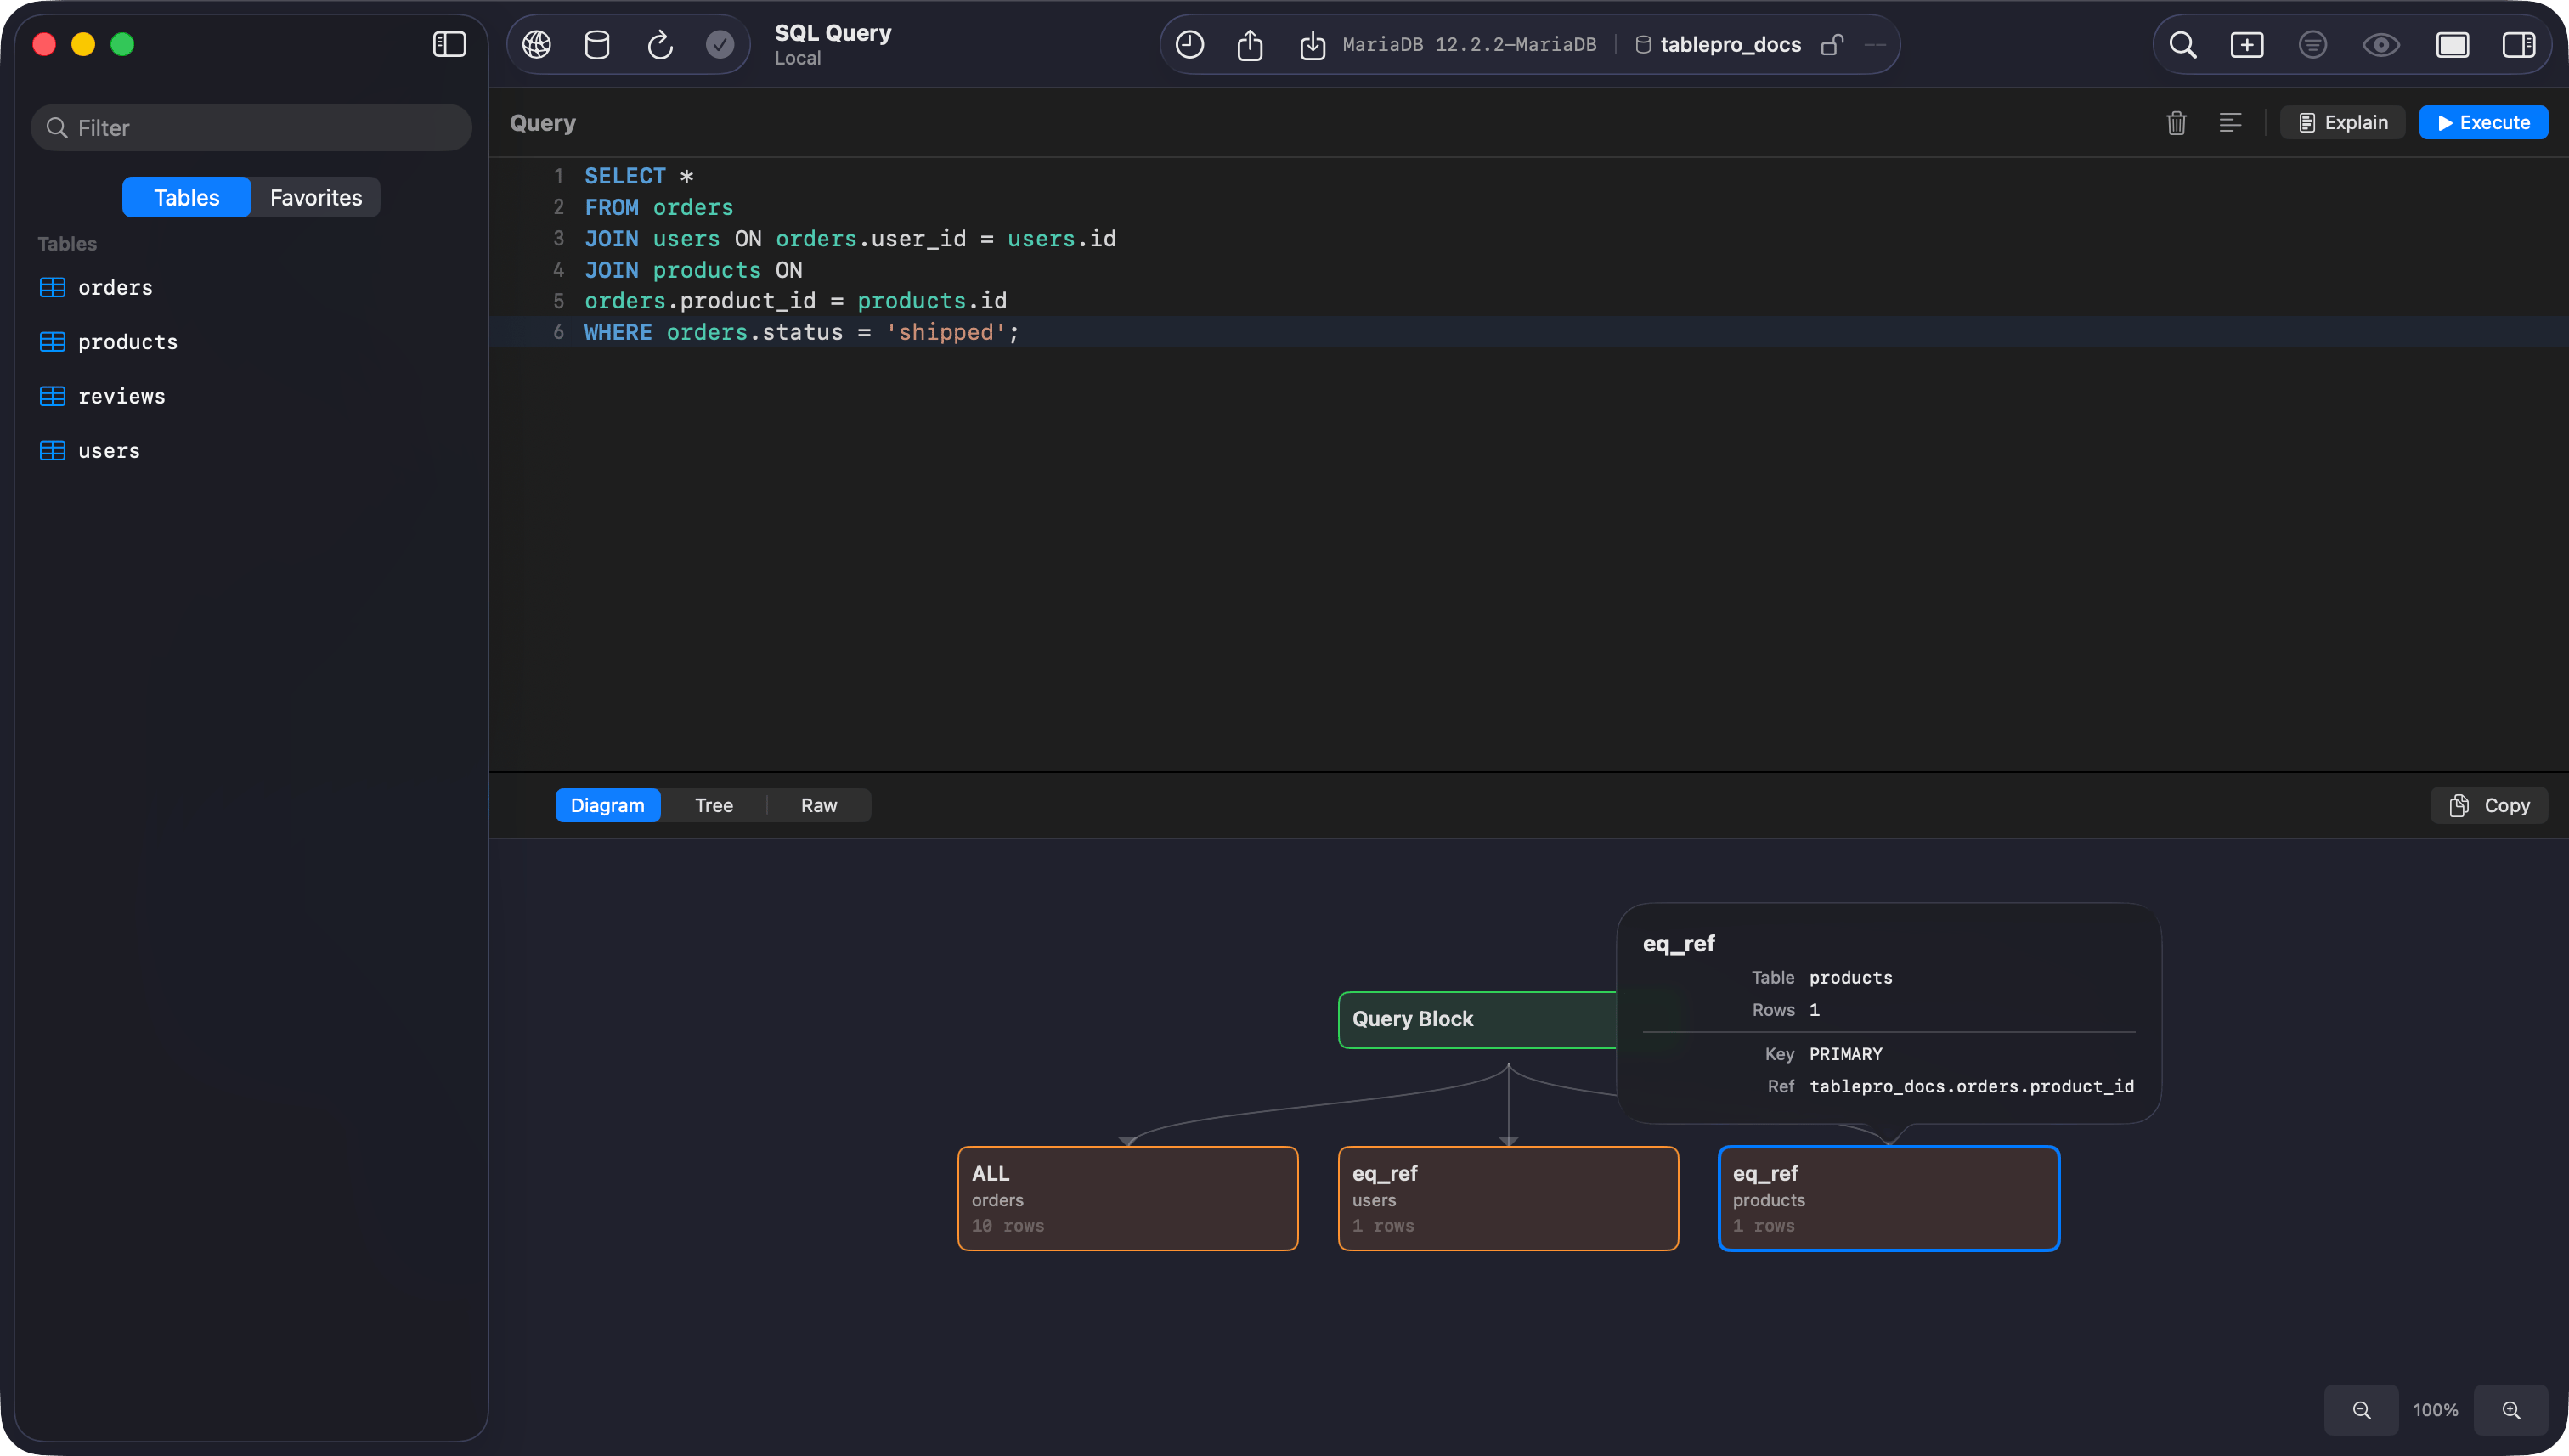
**Diagram** shows the plan as boxes connected by arrows, top to bottom. Nodes are color-coded by cost: green (cheap) to red (expensive). Click a node to see full details in a popover. Zoom controls are in the bottom-right corner.
## View Modes
Toggle between three views using the segmented control above the results:
**Diagram** shows the plan as boxes connected by arrows, top to bottom. Nodes are color-coded by cost: green (cheap) to red (expensive). Click a node to see full details in a popover. Zoom controls are in the bottom-right corner.

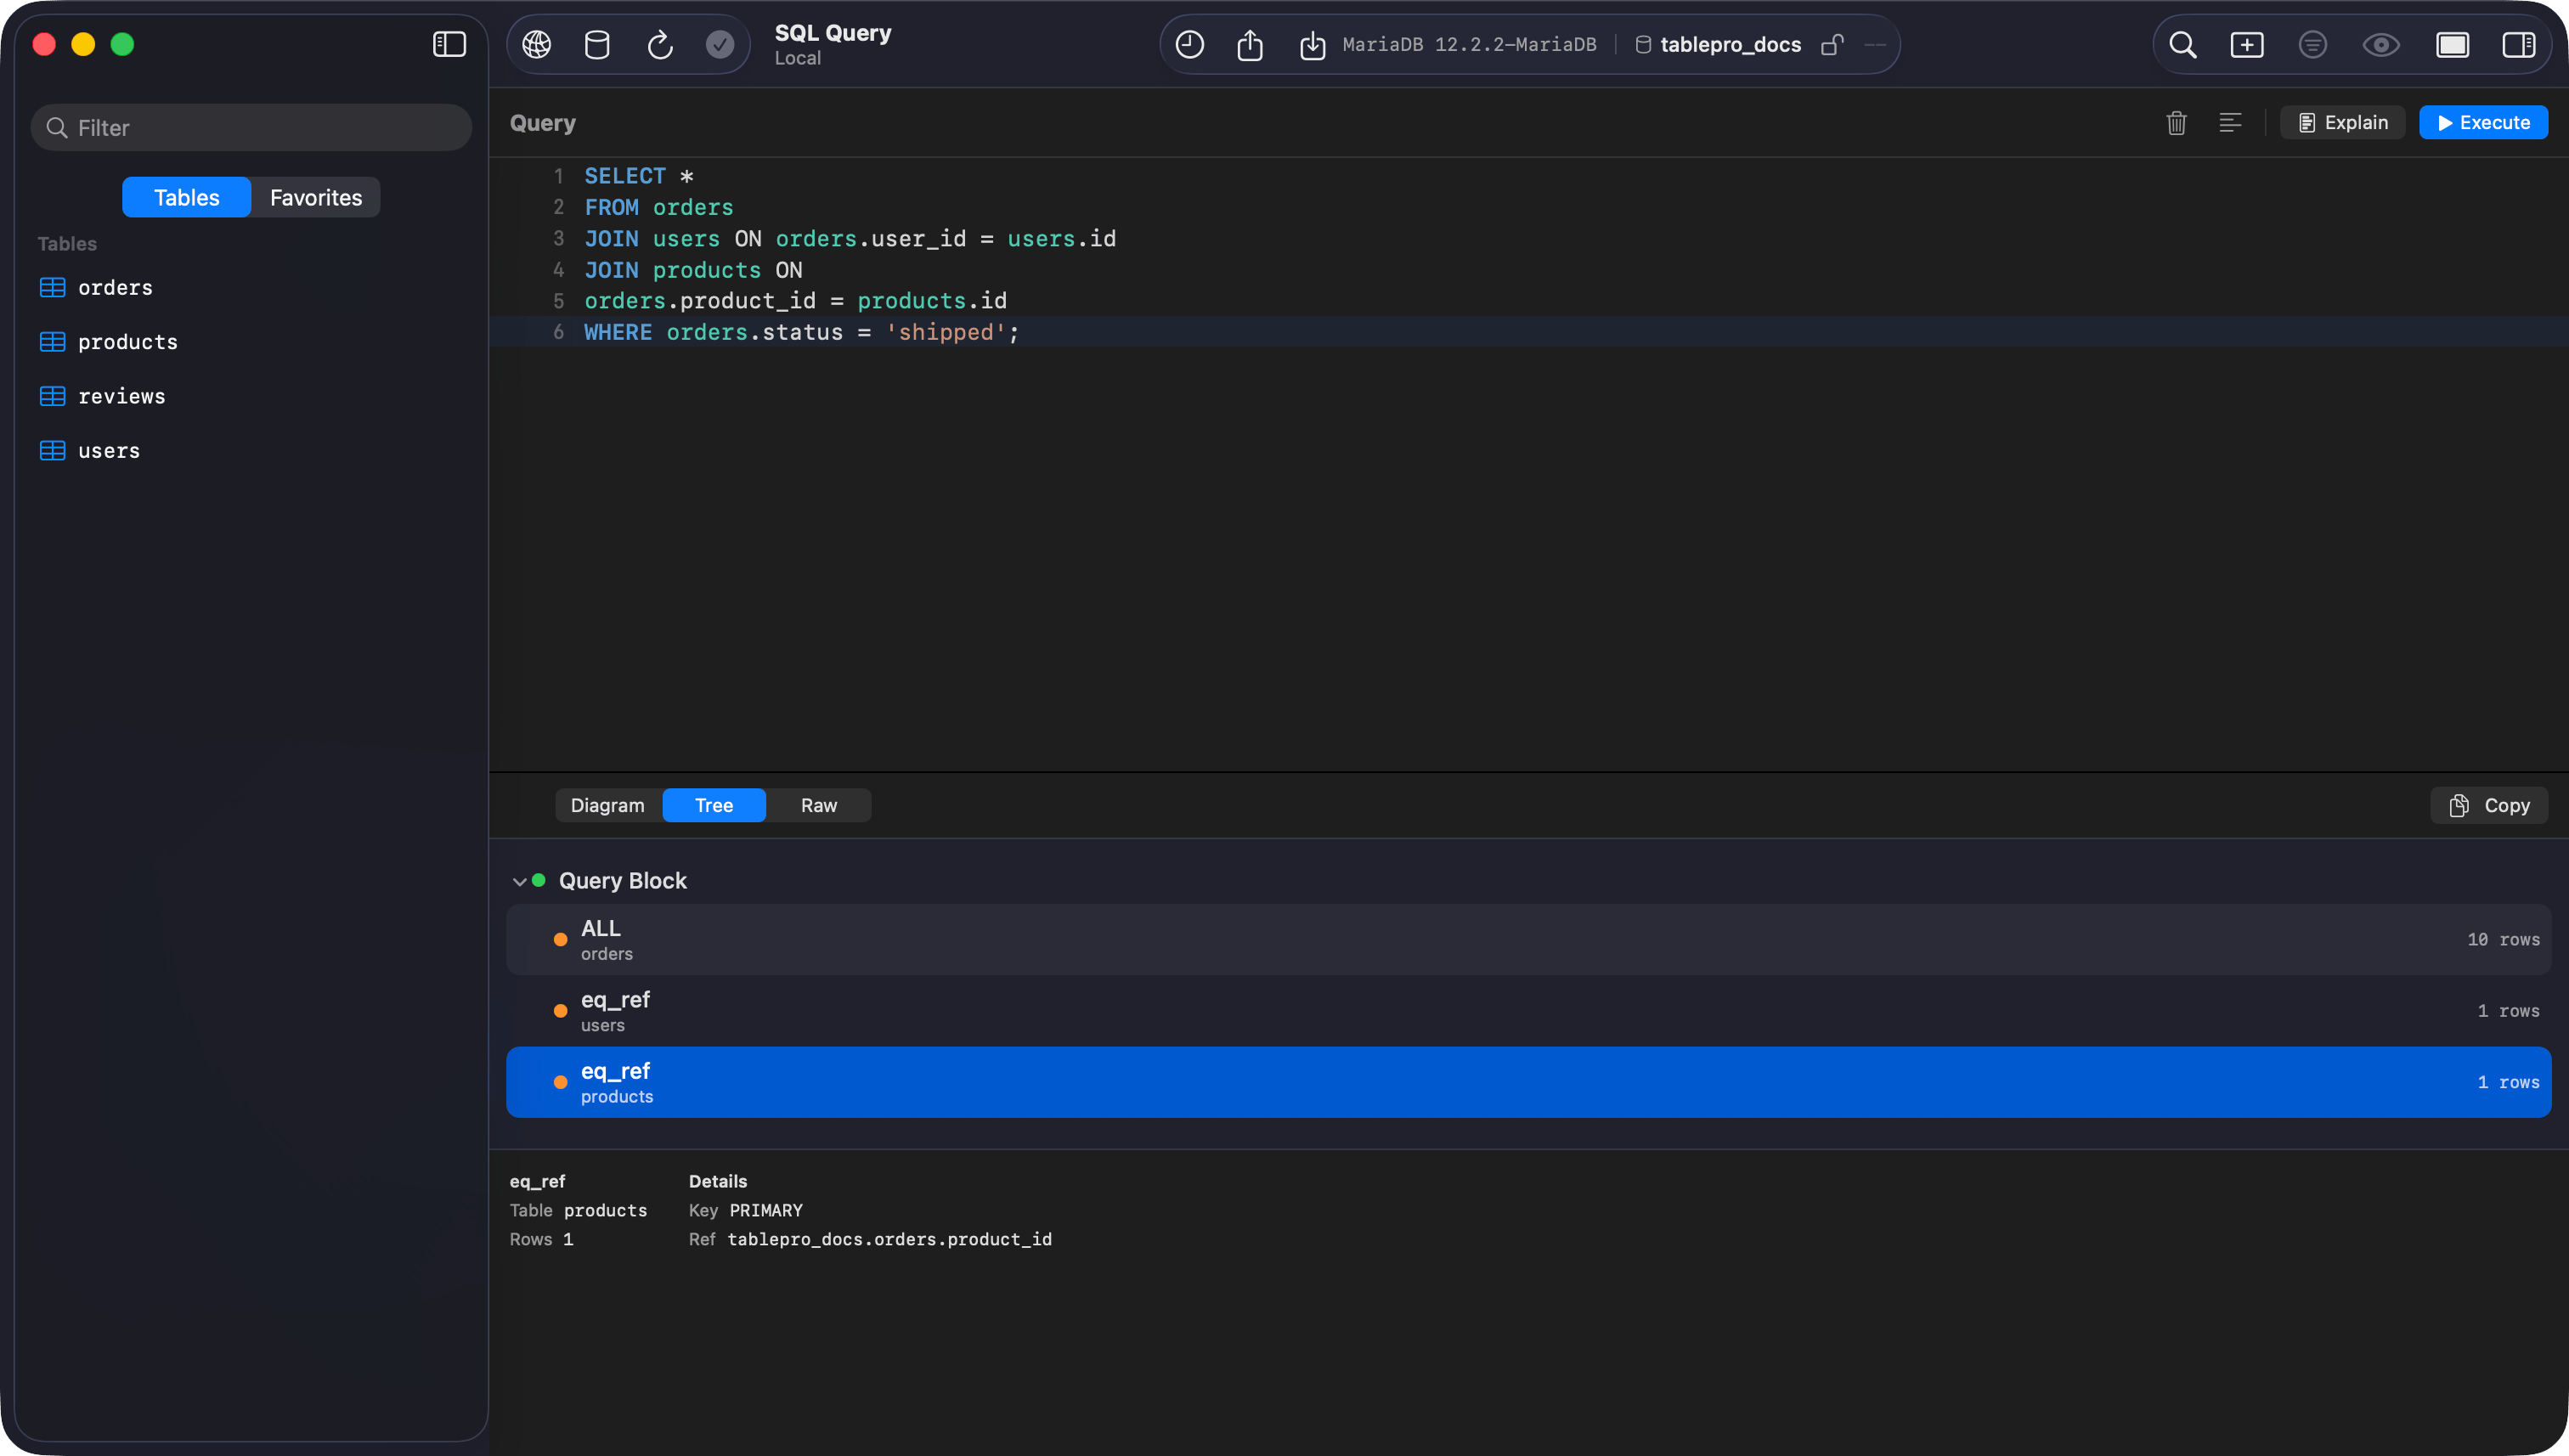 **Tree** shows the plan as an expandable outline list. Click a row to see its properties in the detail panel below. Cost and row estimates are shown on the right side of each row.
**Raw** shows the original EXPLAIN output as text (JSON for PostgreSQL and MySQL, plain text for others).
## Database Support
| Database | Format | Variants |
| ------------- | ------------------------------------- | ------------------------------------- |
| PostgreSQL | JSON (parsed into diagram/tree) | EXPLAIN, EXPLAIN ANALYZE |
| MySQL/MariaDB | JSON (parsed into diagram/tree) | EXPLAIN |
| SQLite | EXPLAIN QUERY PLAN (parsed into tree) | Explain |
| ClickHouse | Indented text | Plan, Pipeline, AST, Syntax, Estimate |
| DuckDB | Indented text | Explain |
| Cloudflare D1 | EXPLAIN QUERY PLAN | Query Plan |
| BigQuery | Dry run cost estimate | Dry Run |
## Plan Details
Each node in the plan shows:
* **Operation**: Seq Scan, Index Scan, Hash Join, Nested Loop, Sort, etc.
* **Table**: which table the operation accesses
* **Cost**: startup and total cost estimates (PostgreSQL format: 0.00..45.18)
* **Rows**: estimated number of rows
* **Actual time**: real execution time per node (EXPLAIN ANALYZE only)
Click a node to see all properties including join type, index name, filter conditions, and sort keys.
EXPLAIN does not execute the query. EXPLAIN ANALYZE executes it and shows actual timing; use it cautiously on production systems.
**Tree** shows the plan as an expandable outline list. Click a row to see its properties in the detail panel below. Cost and row estimates are shown on the right side of each row.
**Raw** shows the original EXPLAIN output as text (JSON for PostgreSQL and MySQL, plain text for others).
## Database Support
| Database | Format | Variants |
| ------------- | ------------------------------------- | ------------------------------------- |
| PostgreSQL | JSON (parsed into diagram/tree) | EXPLAIN, EXPLAIN ANALYZE |
| MySQL/MariaDB | JSON (parsed into diagram/tree) | EXPLAIN |
| SQLite | EXPLAIN QUERY PLAN (parsed into tree) | Explain |
| ClickHouse | Indented text | Plan, Pipeline, AST, Syntax, Estimate |
| DuckDB | Indented text | Explain |
| Cloudflare D1 | EXPLAIN QUERY PLAN | Query Plan |
| BigQuery | Dry run cost estimate | Dry Run |
## Plan Details
Each node in the plan shows:
* **Operation**: Seq Scan, Index Scan, Hash Join, Nested Loop, Sort, etc.
* **Table**: which table the operation accesses
* **Cost**: startup and total cost estimates (PostgreSQL format: 0.00..45.18)
* **Rows**: estimated number of rows
* **Actual time**: real execution time per node (EXPLAIN ANALYZE only)
Click a node to see all properties including join type, index name, filter conditions, and sort keys.
EXPLAIN does not execute the query. EXPLAIN ANALYZE executes it and shows actual timing; use it cautiously on production systems.